The JavaScript still worked. The array could still be emptied. Console events still reached the client. Yet a recovered DataDome inspection probe stopped producing its automatic signal.
The difference was the browser build.
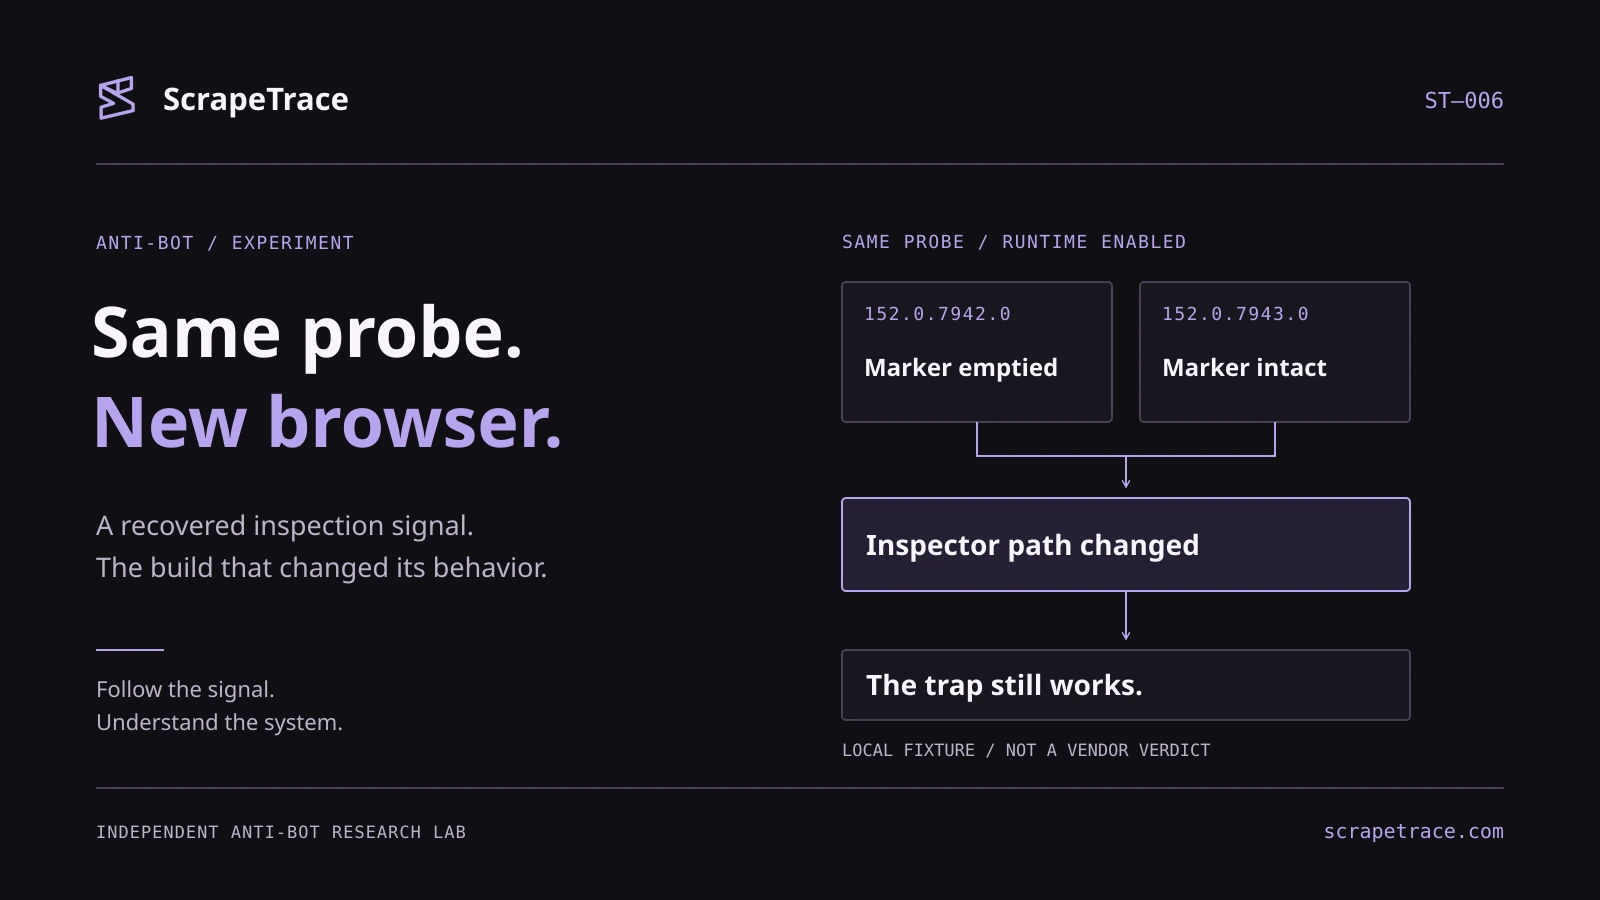
On Chrome-for-Testing 152.0.7942.0, enabling the Chrome DevTools Protocol’s Runtime domain was enough to empty the probe’s marker array. On 152.0.7943.0, the four entries stayed in place. Deliberately asking for the Proxy’s keys still emptied it afterward.
The trap survived. The inspector stopped taking the path that triggered it.
We traced that difference from an archived DataDome VM reconstruction to a local experiment and a matching V8 source change. The result explains one specific signal, without turning its disappearance into a claim that CDP or automation became invisible.
What we found
- A visible console was not required for the older result. The controlled tests were headless. Runtime-enabled inspection triggered the construction without an open DevTools panel.
- A CDP connection was not enough. Bare attachment and Debugger-only controls left the marker unchanged on both sides of the boundary.
- The newer browser still delivered the console event. Explicit enumeration also still activated the trap. The missing side effect was narrower than a broken console or a broken Proxy.
- Full build numbers mattered. The transition occurred between two available development snapshots inside milestone 152. “Chrome 152” alone does not describe both behaviors.
The recorded results and local reproduction package contain the 45 Proxy trials used here, with their protocol transcripts. Other detector experiments stored in the original research directory are outside this article.
An array with two jobs
Our earlier DataDome VM analysis covered a CAPTCHA-client snapshot dated 9 September 2026. Inside that reconstruction was a compact console inspection probe. With explanatory variable names, its recovered behavior is:
const marker = ["e", "l", "o", "i"];
marker.ownKeys = Array.prototype.splice;

const proxy = new Proxy({}, marker);
const probe = {};
Object.setPrototypeOf(probe, proxy);

console.groupEnd(probe);
const inspected = !marker.length;
The array has two jobs. It holds four marker strings, and it is also the Proxy handler. Its ownKeys property points directly to Array.prototype.splice.
When an operation requests the Proxy’s own keys, JavaScript calls that handler method with the handler as this and the target object as its argument. Here, that behaves like calling splice on marker with the empty target object as the start position.
That object converts to a numeric start of zero. With the delete count omitted, splice removes everything from that position onward. The removed strings become the trap’s returned key list, while the marker array becomes empty. These steps follow the language’s Proxy own-key operation and array splice algorithm.
The Proxy sits in the prototype chain of the object passed to console.groupEnd. If console inspection reaches it and requests its keys before the next statement, !marker.length becomes true.
The array mutation is the observable signal. No JSON conversion is needed.
Where the recovered result goes
The archived DataDome reconstruction records a true result under standard Puppeteer and a false result under a patched Runtime path. It also traces that boolean into the module’s internal lookup/mixing state, where it selects which table cell is written.
That establishes a consumer inside the recovered program. The archive leaves the corresponding final token field unresolved. We therefore use the recovered construction to investigate browser behavior, without assigning it an unproven server-side meaning.
Closing DevTools is not the same as changing the inspection path
“DevTools closed,” “CDP attached,” “Runtime enabled” and “Debugger enabled” describe different conditions. Treating them as a single debugging switch makes this probe harder to explain.
| Condition | What it changes | What this study establishes |
|---|---|---|
| DevTools panel open or closed | The visible browser interface and its client activity | Not independently varied in the controlled matrix |
| CDP attached | A protocol client is connected to the page target | Attachment alone did not trigger this construction |
| Runtime enabled | The client enables the Runtime domain, including console events | Triggered the older build’s automatic side effect |
| Debugger enabled | The client enables the Debugger domain | Debugger-only did not trigger this construction |
| Explicit inspection | Client-requested page code enumerates the Proxy’s keys | Activated the trap separately from automatic previewing |
The older headless Runtime result is the useful counterexample to “it only detects an open console.” There was no visible panel to open. Conversely, a negative result under Debugger-only setup is not proof that no debugging client exists.
The archived DataDome work also records a standard-Puppeteer positive result and a patched Runtime-path negative result. That is a separate historical comparison, not another row in the build matrix. We do not publish the patch as a bypass recipe or treat that broader comparison as a single-variable experiment. The direct-CDP controls below supply the narrower evidence.
Methodology
The browser-boundary experiments were recorded on 28 October 2026. They used the recovered Proxy construction on a local fixture, Linux browsers in headless mode, fresh profiles for each trial, and direct CDP commands. No live DataDome challenge was contacted for this matrix.
We compared five configurations, with three fresh-profile trials per configuration on each browser:
- No CDP client connected.
- A CDP client attached, with neither Runtime nor Debugger enabled.
Runtime.enableonly.Debugger.enableonly.- Runtime enabled, followed by explicit enumeration of the Proxy as a positive control.
The two adjacent Chrome-for-Testing builds account for 30 successful Proxy trials. An additional 15 trials on installed Chrome 153.0.8010.36 provide a later-build check. Separate Error-stack experiments in the same evidence directory are excluded from these counts.
The fixture waited for the selected domain setup before executing the console call. It captured marker.length immediately afterward, then reported primitive values over local HTTP. The measurement client did not inspect the marker array to retrieve the result. We omitted diagnostic console calls that would print the array and introduce another inspection opportunity.
Protocol transcripts preserve the commands and console events. Browser.getVersion supplies the actual browser and V8 versions, independently of the page’s user-agent string.
For this article, we reviewed those stored records and verified their consistency. We did not rerun the browser experiments while preparing the article.
Findings
One adjacent build changes the result
| Runtime-only measurement | Chrome 152.0.7942.0 | Chrome 152.0.7943.0 | Chrome 153.0.8010.36 |
|---|---|---|---|
| V8 version | 15.2.51 | 15.2.59 | 15.3.76.10 |
| Immediate marker length, three trials | 0, 0, 0 | 4, 4, 4 | 4, 4, 4 |
| Automatic probe trigger | 3/3 | 0/3 | 0/3 |
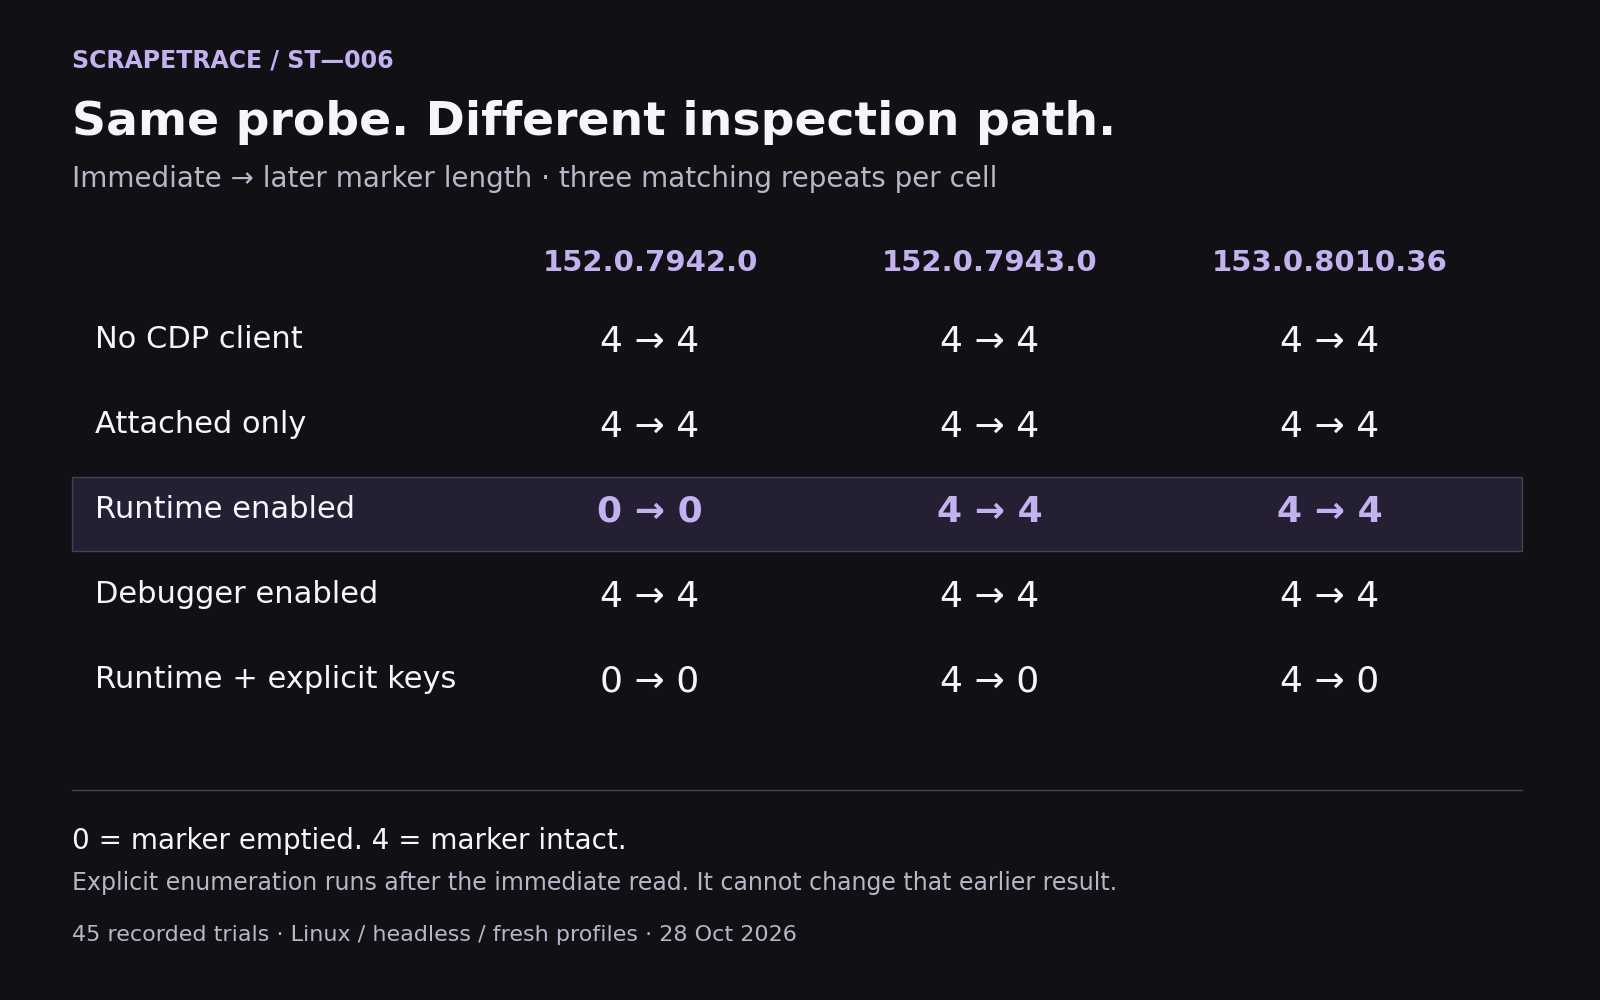
These are counts of repeated local observations, not detection-accuracy estimates. The adjacent versions are development snapshots within milestone 152. Saying only “Chrome 152” hides the transition inside that milestone.
Source bisection across the available Chrome-for-Testing builds located the same boundary as execution. The pinned V8 revision changes from 31658f8212d09a3d47f19740654bcc5882e70293 to f25383729afdb562c78de348453ab9a6620c550c.
Attachment alone does not empty the array
| Configuration | 152.0.7942.0 | 152.0.7943.0 |
|---|---|---|
| No CDP client | No trigger, 3/3 | No trigger, 3/3 |
| Attached, neither domain enabled | No trigger, 3/3 | No trigger, 3/3 |
| Runtime enabled | Trigger, 3/3 | No trigger, 3/3 |
| Debugger enabled | No trigger, 3/3 | No trigger, 3/3 |
| Runtime plus explicit enumeration | Trap activated, 3/3 | Trap activated, 3/3 |
The attachment-only control matters. In this fixture, a CDP connection by itself was insufficient even on the older build. The observed difference depended on the Runtime-enabled console path.
The trap survives the change
The positive control deliberately executed:
Reflect.ownKeys(Object.getPrototypeOf(probe));That emptied the marker on both sides of the boundary. On the newer build, the immediate post-console snapshot was still four. Explicit enumeration activated the trap afterward.
This separates two events that can otherwise look identical in a final screenshot: automatic inspection during the console call, and later page-code execution that deliberately requests keys. Only the first can change this probe’s synchronous readback.
Console events also continued to arrive after the boundary. The negative result was accompanied by working event delivery and a functioning trap.
The iterator stops at the Proxy
The matching V8 inspector change, commit ede68f0, adds a loop in DebugPropertyIterator::AdvanceToPrototype() that skips Proxy objects encountered in the prototype chain. Its regression test checks that previewing Map/Set entries does not invoke those Proxy traps.
The recovered DataDome construction uses console.groupEnd, rather than a Map or Set. Our separate console measurements establish the relevant behavior for that construction. Together, the shared iterator change, pinned source boundary, and adjacent-build observations explain why the array stops being emptied automatically.
The distinction matters when searching for the fix: the commit’s title describes a Map/Set preview problem, while the changed iterator also affects the console case measured here.
What this means for a browser signal
A detector can depend on behavior outside the page’s own code. Here, the marker relies on an inspector walking far enough through an object’s prototype chain to execute a page-controlled trap. Once that inspection path skips the Proxy, the detector’s observable side effect disappears.
Recovering the JavaScript was therefore only half the explanation. The other half was identifying the engine behavior that made the construction useful, and checking whether the tested browser still had it.
For anyone reproducing inspection probes, the full browser version and client configuration belong beside the code. A snippet that demonstrates a signal on one build may produce an unchanged marker on another, even while the console and Proxy both continue to work.
Limitations
- Vendor attribution concerns the archived DataDome snapshot. We did not audit the current deployed client or test whether it uses another inspection signal.
- The matrix covers Linux, headless execution, fresh profiles, and the stated direct-CDP configurations. Headed DevTools, manual expansion, other clients, operating systems, and downstream Chromium builds need their own measurements.
- The boundary is between adjacent available Chrome-for-Testing snapshots. It does not establish the first patched release in every channel or product.
- Three trials per configuration demonstrate a consistent result in these records. They do not establish population-wide reliability.
- The earlier patched-Puppeteer comparison changed more than one implementation detail. The direct-CDP matrix supplies the isolated Runtime comparison used here.
- Initial attempts to run downloaded browsers from a filesystem mounted
noexecfailed before measurement. Those failed launches remain in the source records and are excluded from detector counts. - The observations establish the loss of this probe’s automatic trigger. They do not establish a DataDome server decision or universal CDP invisibility.
Reproduction
The snippet above reproduces the recovered construction. Checking the build boundary requires a controller that configures the domains before releasing the page, records the immediate marker through a separate channel, and retains protocol transcripts.
Use the official Chrome-for-Testing version and download index to identify the two full versions. Run the five configurations above with a fresh profile each time. Record Browser.getVersion, the synchronous marker length, later marker length, and received console events.
Keep the positive control separate: explicit enumeration should activate the trap even on the newer build. Logging or expanding the probe or marker while collecting results can contaminate the measurement.
Download the Proxy-only reproduction package. It contains the recorded fixture, 45 successful observations, protocol transcripts, a saved-data verifier and a standalone local controller derived from the original harness. Local executable paths in experiment metadata are replaced with a placeholder. Measured values and protocol records are retained.
# Requires Node.js 22+ for the bundled local controller.
node verify.cjs

# Supply the exact browser build you want to compare.
PROBE_BROWSER=/absolute/path/to/chrome node run-matrix.cjs
The controller runs only a loopback fixture and writes new timestamped runs without overwriting the supplied evidence. It preserves the recorded headless flags, including --no-sandbox, which is documented in the package. The exported controller was syntax-checked and its saved-data verifier passed. It was not newly executed against downloaded browser builds during article preparation. The original browser observations remain the evidence for the result.
The full private reconstruction, internal VM mappings and patched-Puppeteer implementation are not in this package. No live vendor bundle or challenge token is included.
Attribution and disclosure
The probe is attributed to the archived DataDome reconstruction, not claimed as a technique invented by ScrapeTrace. The inspector fix belongs to the V8 contributors credited in the linked commit. ScrapeTrace’s contribution here is connecting the recovered construction to controlled browser observations and the adjacent source boundary. DataDome was not involved in the local boundary tests.
A working trap is not a working detector. The browser still has to take the path that reaches it.
Found a mistake or a result you cannot reproduce?
Send a correctionReference: /articles/datadome-cdp-probe-chrome-152/