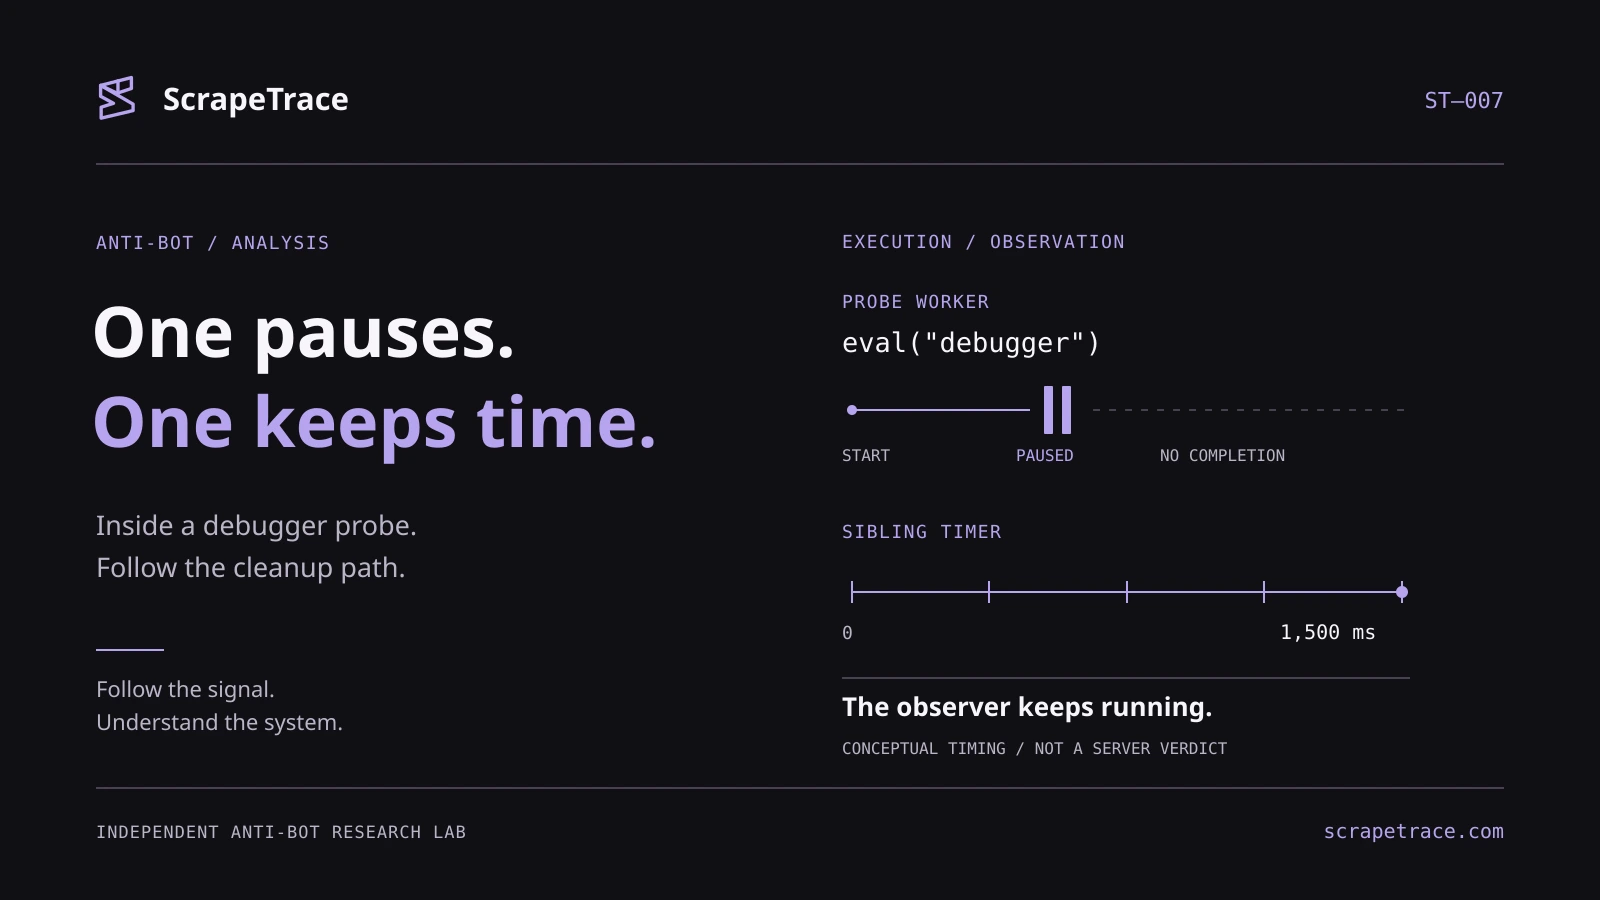
A Cloudflare challenge paused inside a Worker at a single word: debugger.
Roughly a second and a half later, the debugger reported that execution had resumed. Almost immediately, the Worker disappeared. We had not sent a resume command.
It was tempting to read that sequence as a short pause followed by normal execution. But one message was missing: the completion marker immediately after the debugger statement.
The Worker did not need to finish for the surrounding code to finish observing it.
We followed the probe from captured source through local browser controls and into two instrumented live controller traces. The interesting part is the coordination: one Worker can stop executing while a sibling timer and the challenge controller continue toward cleanup and a recorded client result.
What we found
- Selecting Console did not avoid the pause. Ordinary DevTools paused the probe Worker in the tested Chrome build, then switched to Sources. Deactivating breakpoints while leaving DevTools open restored completion.
- The live controller had two observed cleanup paths. A completion handler terminated the probe promptly in one trace. A sibling timer listener terminated it after missing completion in another.
- A resumed event did not prove the probe completed. Local termination controls produced that event without the completion marker.
- The client result was traceable. Its server meaning was not. Both live paths continued into a collector write, but the opaque values do not establish an accept, reject or universal “DevTools detected” decision.
The public evidence selection includes 51 local observations, two sanitized live timelines and an explanatory local demo. Full live challenge payloads and tokens remain private.
Three lines around a pause
The original three reproductions captured a dedicated Worker with a blob: URL under challenges.cloudflare.com. Each contained the same 152-character probe source. Formatting the recovered code gives:
try {
  postMessage({ nAOXb9: "kxQk1", xqJr8: performance.now() });
} catch (_err) {}
eval(_p ? _p.createScript("debugger") : "debugger");
postMessage({ seMw9: "XnWrA3" });
The first message carries a timestamp. The nested evaluation contains the debugger statement. The final message can be sent only if execution reaches the line after that evaluation. The optional _p is a Trusted Types policy supplied by the captured bootstrap, whose createScript callback returns the supplied string.
The source hash is:
683c645254dd3f22f576350bb074cfe80dc62c6f188fc62fc9ee22d180e6e5d4These names belong to that captured payload. Later live payloads used different message keys and values, so our analysis matches each capture against its own dispatched source.
The small script does not compute a duration or announce a verdict. It produces events that another part of the program can observe.
A VM5 label in DevTools was the debugger’s label for dynamically evaluated source. It was not, by itself, evidence of a fifth virtual machine or an opcode in Cloudflare’s bytecode interpreter. The paused stack connected that one-word evaluation to the probe and its message-driven Worker bootstrap.
The observer is outside the paused Worker
If the probe Worker pauses, it cannot execute the next postMessage while that pause remains unresolved. Code elsewhere can still receive its earlier start message, wait for completion, or react to a separate timer.
We independently captured a sibling Worker’s 1,500 ms timer. That gives the controller an event that does not require the paused probe to make progress.
The coordination is easier to follow as two message paths:
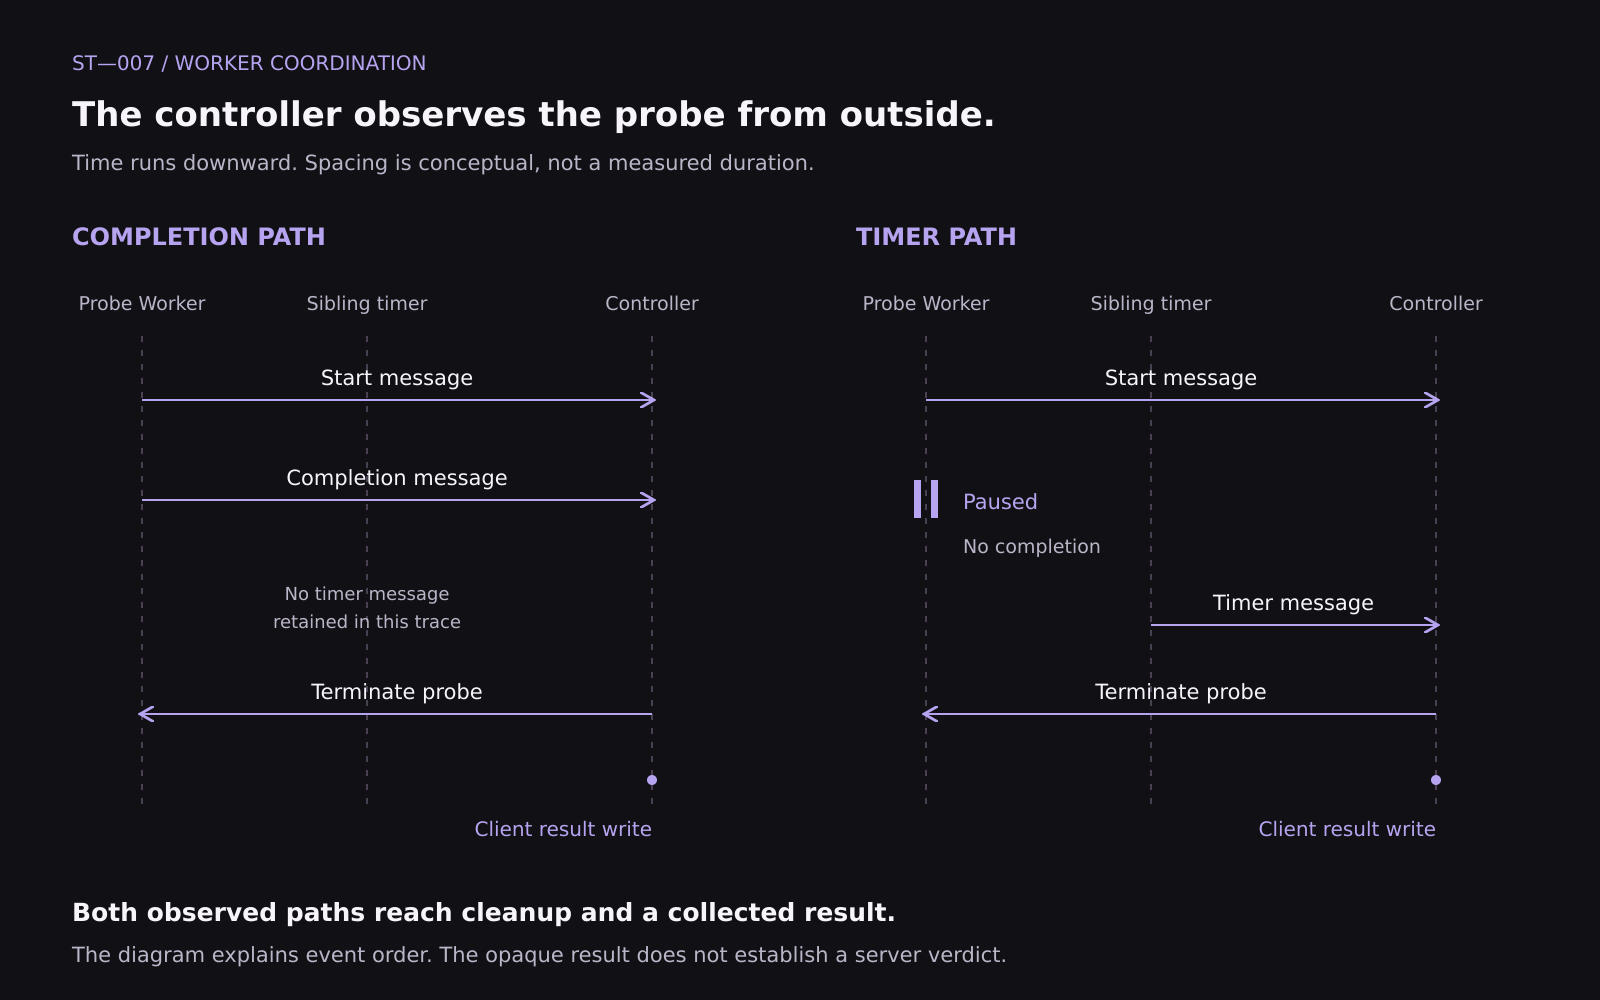
The small probe supplies the events. The HTML worker model supplies the underlying message and termination APIs.
That distinction matters. A plausible reconstructed watchdog can explain an observation, but it cannot tell us which callback ran in the real challenge. We needed both the controlled fixture and the original controller trace.
Methodology
We kept three evidence groups separate.
Original captures, 28 October 2026. Three live reproductions established the Cloudflare-origin source, its paused stack and the short-lived Worker lifecycle. An earlier 24-trial local matrix investigated attachment, Runtime, page-only Debugger, Worker debugging and pause controls. Those trials are context, not part of the newer 51-trial total.
Follow-up controls, 3 November 2026. We ran 51 verified local trials on Linux Chrome 154.0.8037.57, V8 15.4.80.11: a 39-trial matrix and a corrected 12-trial UI batch. Each trial used a fresh Chrome process and temporary profile. Three repeats of a condition are repeated observations on one host, not independent devices.
The local fixture used the exact captured probe and timer with our own controller. Execution waited for the selected debugger setup. The page reported primitive events over loopback HTTP, avoiding Runtime inspection of the probe Worker to retrieve results.
Headed UI cases used Chrome’s bundled DevTools. The measurement client inspected only the DevTools frontend, not the page or Workers. Direct-protocol cases were headless and enabled Debugger on Workers without Runtime commands. Comparisons within each mode supply the useful controls. Headed and headless rows are not a single-variable comparison.
Live controller traces, 3 November 2026. Two primary executions on a Cloudflare-protected site in fresh incognito contexts followed actual challenge callbacks through cleanup and client result storage. The same observation connection remained attached in both. One had actual DevTools UI opened by the investigator; the other did not. Neither is an uninstrumented or disconnected-browser baseline.
Live instrumentation wrapped Worker messaging, handlers and termination, retained VM references, and observed selected object writes. It also delayed later page completion to retain the frame. These interventions affect identities and timing, so the live numbers describe individual traces rather than performance benchmarks. They do not manufacture the probe messages, but they prevent us from treating the executions as untouched browsing.
During article preparation, we reran the saved-data verifiers. We did not repeat the historical browser matrix or collect additional live challenge executions.
Findings
Console was selected. The Worker still paused.
The initial UI batch exposed a useful measurement mistake: a saved preference had not actually selected Console. Chrome opened Elements. We retained those trials as DevTools-open evidence, then ran a correction that explicitly selected Console and verified its state before releasing the probe.
| Corrected headed control | Outcome | Repeats |
|---|---|---|
| DevTools closed | Completion, 2.3–4.7 ms | 3 |
| Console selected, default breakpoints | Watchdog, 1502.1–1502.7 ms | 3 |
| Console selected, breakpoints deactivated | Completion, 5.2–5.6 ms | 3 |
| Console selected, then DevTools closed before release | Completion, 3.8–5.9 ms | 3 |
Frontend model state confirmed that the probe Worker was paused while the sibling Worker was not. DevTools automatically switched from Console to Sources when it paused. That switch is part of the observation, not a failure to select Console first.
Leaving DevTools open while deactivating breakpoints is the important counterexample. The UI remained present, but the blocking effect disappeared. This construction responds to execution interruption under the tested settings. It does not directly read whether a particular panel is visible.
Exception settings and debugger statements are different controls
The direct-Worker controls used the Debugger protocol, with setup completed before releasing the fixture.
| Direct Worker condition | Local outcome | Repeats |
|---|---|---|
| Debugger enabled | Watchdog, no completion | 3 |
| Breakpoints inactive | Completion | 3 |
| Pause on exceptions set to none | Watchdog, no completion | 3 |
| Resume about 100 ms after pause receipt | Completion | 3 |
| Resume about 1,000 ms after pause receipt | Completion | 3 |
| Resume scheduled about 1,800 ms later, cleanup enabled | Watchdog, no completion | 3 |
| Same delayed resume, cleanup disabled | Timer event, then later completion | 3 |
| Disable the sole debugger session while paused | Completion | 3 |
| Disconnect the sole debugging client while paused | Completion | 3 |
Turning off exception pausing did not prevent a deliberate debugger statement from pausing in these tests. Conversely, resolving the pause early allowed the completion marker to arrive.
The delayed-resume pair separates the deadline from the Worker’s ability to finish. With cleanup disabled, the sibling timer fired and the probe later resumed and completed. With cleanup enabled, the controller terminated the probe before that later completion could happen.
Scheduled delays began when the client received the pause event. They are not exact pause durations. The 1,500 ms timer is a captured component and our fixture’s deadline, not a recovered server classification threshold.
Following the real cleanup callers
In the live DevTools-open trace, the controller received the probe’s start message. No completion message appeared in the retained trace. The sibling timer listener then ran and called Worker.terminate() on the probe. After that callback returned, a continuation wrote an opaque result into the collected record.
In the no-UI trace, the probe sent completion. Its actual onmessage handler terminated the Worker, returned, and continued to a collector result write.
| Event, relative to probe dispatch | DevTools UI open | No DevTools UI opened |
|---|---|---|
| Start received | 19.295 ms | 7.065 ms |
| Completion received | Not observed | 9.225 ms |
| Probe termination | 1510.410 ms | 10.480 ms |
| Client result write | 1516.795 ms | 16.535 ms |
| Observed cleanup caller | Sibling timer listener | Probe completion handler |
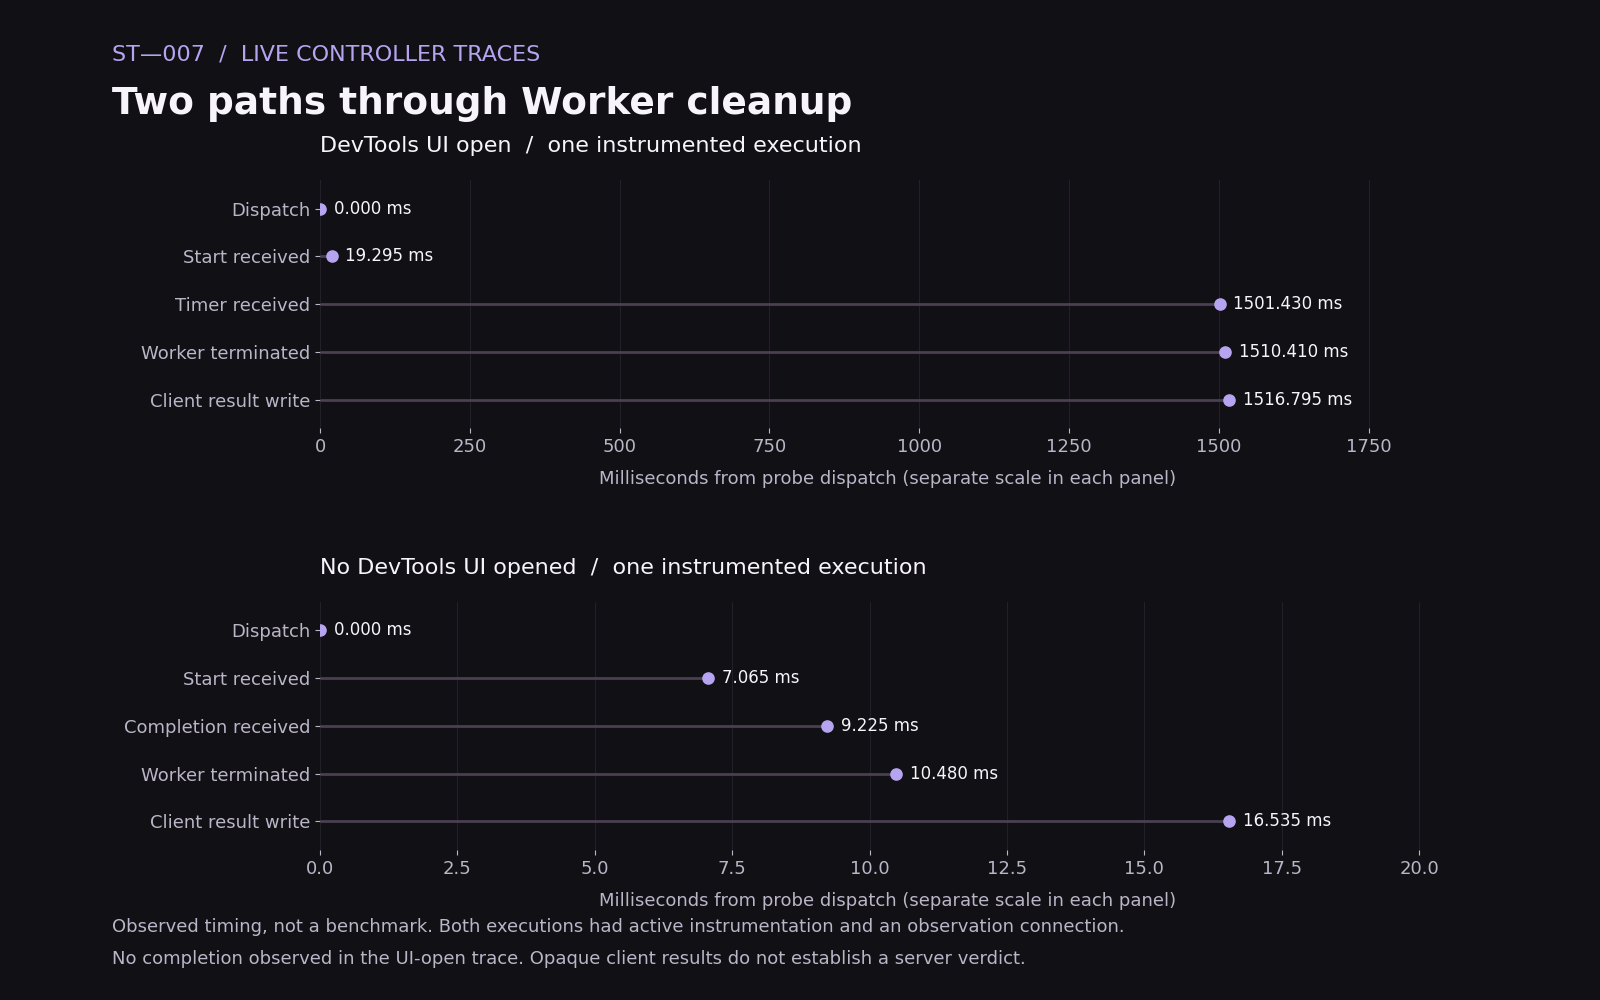
The verification followed callback nesting, the active VM call at termination, collector object identity and the subsequent property write. The completion path also has a separate final read confirming the stored value. The timeout path has the intercepted write observation, without an equivalent later direct read.
Both paths produced a client result. Their keys, collector slots and opaque values differed between payloads. We cannot compare those strings as if they shared a decoded symbol table, or rename either one blocked or accepted.
The timer message was absent from the retained completion trace. That does not establish how the timer was cancelled or whether another unrecorded lifecycle step ended its work.
From a pause to a collected result
The result does not remain inside the paused Worker. In both live captures, the controller holds a reference to a larger collector, with this probe’s record stored as one entry. We followed that reference through the real callback closure and matched it to the object receiving the subsequent write.
That gives us a concrete client-side chain:
- The start message changes a captured state cell from false to true in both executions.
- The completion handler and timer listener leave different state behind. Completion changes one cell from true to false. The timer path leaves that cell true. Another cell becomes true in both paths.
- After cleanup returns, a continuation writes an opaque outcome into the probe’s collector record.
Using explanatory aliases, that last operation has this shape:
collector[probeSlot][resultKey] = outcomeMarker;The aliases describe the observed object relationship, not Cloudflare’s original names or a fully decoded classification formula. In the completion capture, a later direct read of the same record confirmed the stored marker. In the timer capture, we observed the intercepted write before it was forwarded to the object.
This is more than a pause visible in a developer window: the challenge’s own code consumes the messages, updates state and records a probe outcome alongside other collected data. Terminating the Worker does not erase what the controller has already observed.
The collector write is the last verified link for this particular result. The retained live instrumentation captured incoming challenge responses, but did not trace this record through an outgoing request body. We have not linked this marker to a rolling hash, an encoder input or a transmitted field. Hexadecimal-looking names and values are not evidence of a hashing step. Establishing that next client-side link requires following this same record into the serializer and transport, independently of any server-side interpretation.
“Resumed” did not mean “completed”
The original live captures produced this sequence without a recorder-issued resume command:
Debugger.paused
approximately 1.49 seconds
Debugger.resumed
Target detached
Worker target destroyed
Our local cleanup controls reproduced the event sequence under a known cause: controller termination. No completion marker arrived.
The new live trace separately identified the real timer listener that called termination. Together, these observations resolve the earlier ambiguity without treating a protocol event name as proof that the next source line ran.
Debugger.resumed tells us something about debugger state. The completion message tells us whether this probe reached its next statement and reported it. Those are different observations.
What the probe actually observes
The page does not need to inspect the DevTools window. It can arrange work so that a debugger-induced interruption changes what another execution context receives before cleanup.
For this construction, the useful object of study is the entire sequence: debugger configuration, Worker execution, start and completion messages, independent timer, receiving callbacks and result collection. Stopping at the one-word script misses most of the mechanism.
This differs from the DataDome inspection probe we previously investigated. That construction depended on an inspector invoking a Proxy trap. Here, the captured code contains no console call, getter or own-key serialization trap. The missing completion follows an unresolved execution pause.
A successful local completion is therefore a statement about this path under those conditions. It is not proof that the rest of a Cloudflare challenge will accept that browser.
Limitations
- The controlled matrix covers one Linux host and one Chrome build. Other releases, platforms, DevTools settings and clients need their own measurements.
- The 51 local trials use captured probe code with a reconstructed controller. The two live traces run the actual controller under active instrumentation. We do not pool them into an accuracy rate.
- UI cases and direct-protocol cases differ in headedness. A debugger connection was present even in the live no-UI case.
- Sole-session disable/disconnect controls do not describe multiple simultaneous debugging clients.
- Exploratory live attempts and two local pilot trials are retained privately but excluded from the primary comparison. An incomplete offline controller replay never reached this probe and supplies no negative detection evidence.
- Complete guard logic, cross-payload symbol equivalence, result serialization and server interpretation remain unresolved. Later observation of a normal homepage is not a controlled acceptance test.
- The public package deliberately omits live payloads and tokens. It supports inspecting exported observations and reproducing the small local mechanism, not independently replaying the full live controller trace.
Reproduction
Download the public evidence selection. It contains the 51 local observations, sanitized relative timelines, provenance hashes, a saved-data verifier and a small explanatory demo.
# Python 3. No dependencies required for these two commands.
python3 verify.py
python3 -m http.server 8765 --bind 127.0.0.1
Open http://127.0.0.1:8765/local-demo.html and run the fixture with DevTools closed, then with Console selected. Compare the same open UI with breakpoints deactivated. The output records start, completion or sibling timer and local cleanup. This is newly written explanatory code with readable messages, not the captured Cloudflare controller or the runner that collected the 51 trials.
For a stricter experiment, configure the debugger before releasing execution, use fresh test profiles, record actual browser versions, and collect primitive results outside the probe Worker. Keep the completion marker separate from protocol lifecycle events. Without that separation, cleanup can look like recovery.
The public verifier checks the exported selection. Private verification additionally checks the original source hash, domain isolation, selected panel and paused Worker state, plus the live callback and collector identities. Raw live scripts, flow bodies, challenge tokens and instrumentation remain unpublished.
Attribution and disclosure
Cloudflare is the source of the captured challenge code. ScrapeTrace’s contribution is recovering and connecting the probe, controller paths and browser observations. The two live primary traces came from a Cloudflare-protected site on 3 November 2026. The site is anonymized because this investigation concerns the challenge mechanism, rather than the protected site. No CAPTCHA checkbox was clicked during those captures.
The original probe captures date to 28 October 2026. Follow-up controls and live controller tracing date to 3 November. Browser APIs and protocol commands are linked to their primary documentation above. This article establishes neither a vendor-endorsed explanation nor a server acceptance rule.
A resumed debugger is not proof of a completed probe. Follow the messages through cleanup.
Found a mistake or a result you cannot reproduce?
Send a correctionReference: /articles/cloudflare-worker-debugger/